by David Nurse | Jul 18, 2018 | Blog, Transmission, Locational Marginal Pricing |
SPP Map Tool Overview Energy Acuity’s LMP tool provides users with a unique ability to access, visualize and analyze Locational Marginal Pricing (LMP) across different zones. The tool provides historical real-time and day-ahead hourly LMP, Congestion and Line Loss...
by David Nurse | Jul 18, 2018 | Blog, Transmission, Locational Marginal Pricing |
MISO Map Tool Overview Energy Acuity’s LMP tool provides users with a unique ability to access, visualize and analyze Locational Marginal Pricing (LMP) across different zones. The tool provides historical real-time and day-ahead hourly LMP, Congestion and Line Loss...
by David Nurse | Jul 18, 2018 | Blog, Transmission, Locational Marginal Pricing |
ERCOT Map Tool Overview Energy Acuity’s LMP tool provides users with a unique ability to access, visualize and analyze Locational Marginal Pricing (LMP) across different zones. The tool provides historical real-time and day-ahead hourly LMP, Congestion and Line Loss...
by David Nurse | Jul 18, 2018 | Blog, Transmission, Locational Marginal Pricing |
PJM Map Tool Overview Energy Acuity’s LMP tool provides users with a unique ability to access, visualize and analyze Locational Marginal Pricing (LMP) across different zones. The tool provides historical real-time and day-ahead hourly LMP, Congestion and Line Loss...
by David Nurse | Jul 17, 2018 | Blog, Locational Marginal Pricing |
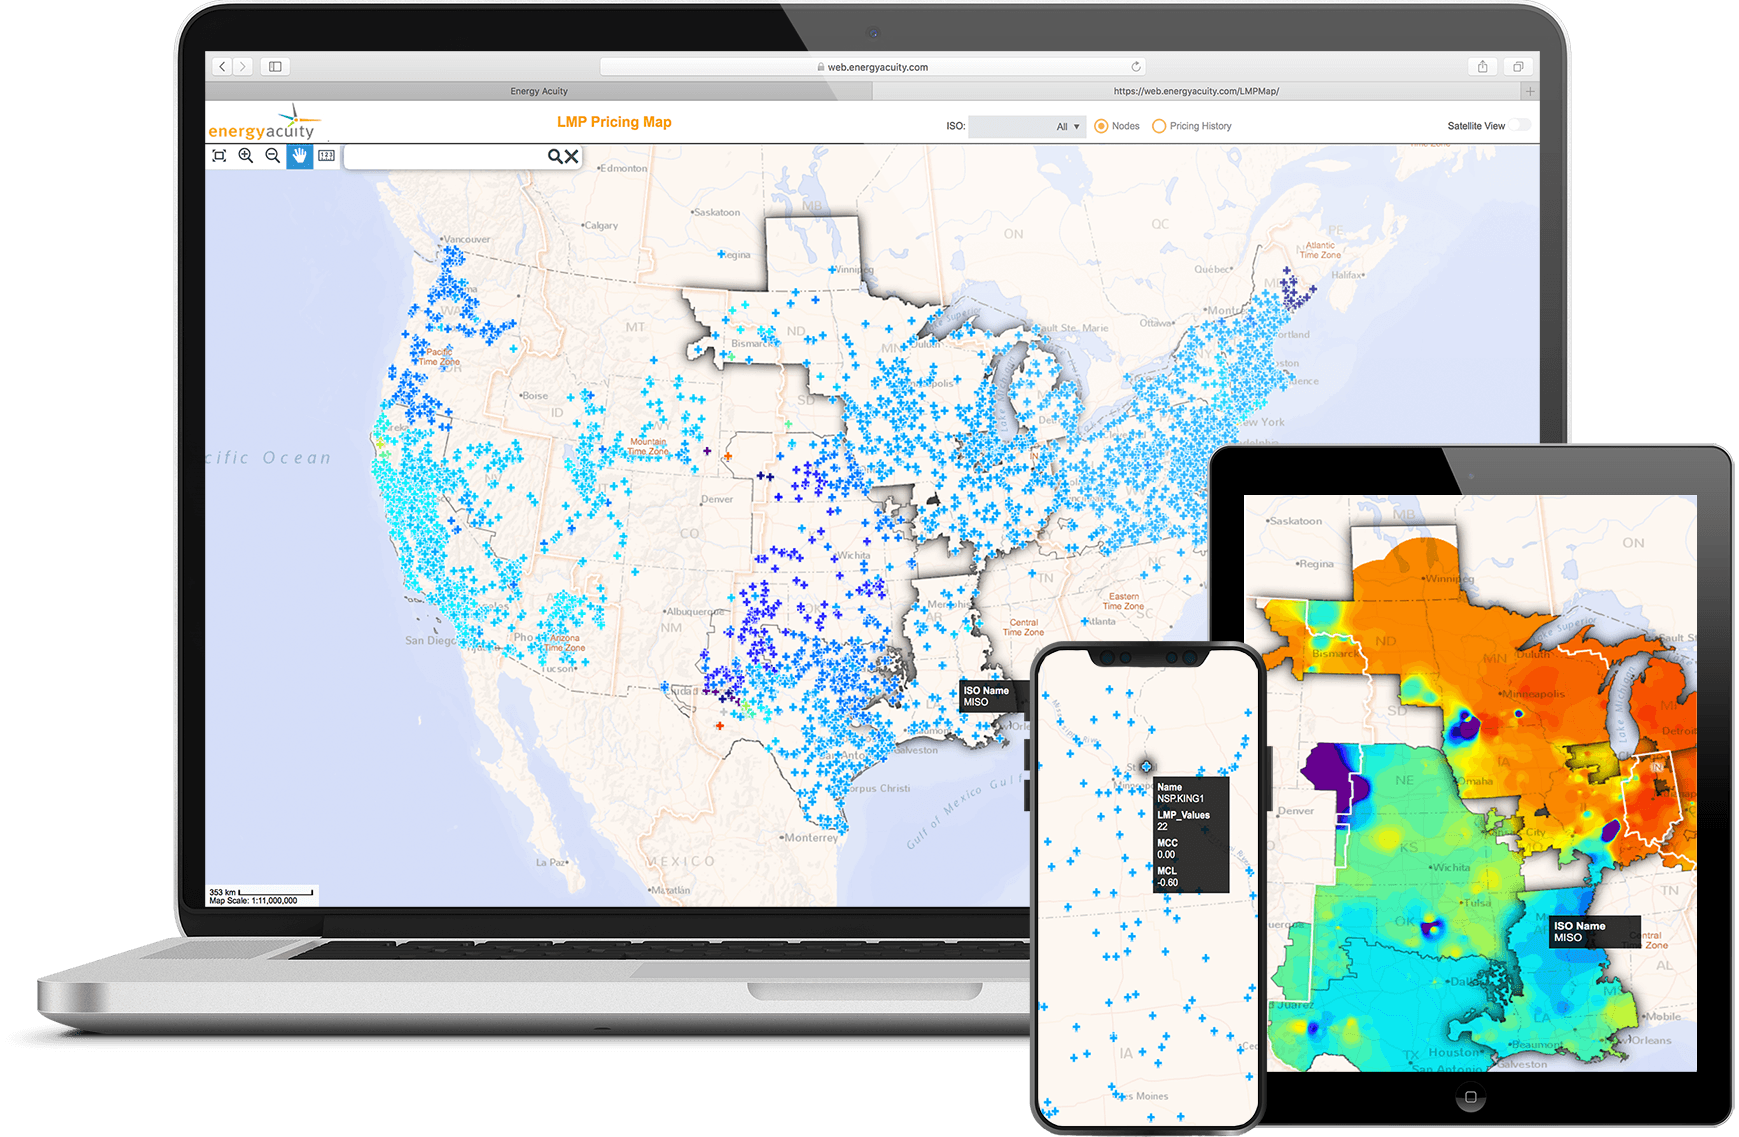
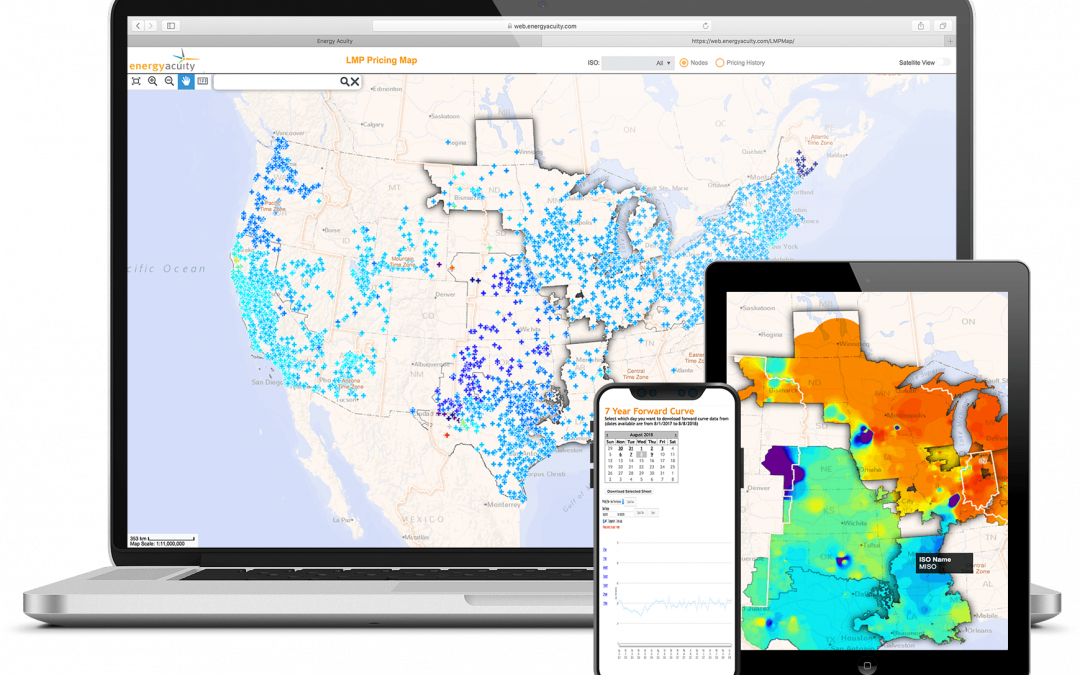
LMP Map The Energy Acuity LMP product provides LMP mapping for all ISO regions across the United States. This interactive mapping feature allows users to view heat maps for a single time period down to the hourly level, or to visualize LMP changes over time. The LMP...
by David Nurse | Jun 28, 2018 | Blog, Locational Marginal Pricing |
PJM LMP Map Tool Overview Energy Acuity’s LMP tool provides users with a unique ability to access, visualize and analyze Locational Marginal Pricing (LMP) across different zones. The tool provides historical real-time and day-ahead hourly LMP, Congestion and Line Loss...
by David Nurse | Jun 28, 2018 | Blog, Locational Marginal Pricing |
MISO LMP Map Tool Overview Energy Acuity’s LMP tool provides users with a unique ability to access, visualize and analyze Locational Marginal Pricing (LMP) across different zones. The tool provides historical real-time and day-ahead hourly LMP, Congestion and Line...
by David Nurse | Jun 19, 2018 | Blog, Locational Marginal Pricing |
ERCOT LMP Map Tool Overview Energy Acuity’s LMP tool provides users with a unique ability to access, visualize and analyze Locational Marginal Pricing (LMP) across different zones. The tool provides historical real-time and day-ahead hourly LMP, Congestion and Line...
by David Nurse | Jun 1, 2018 | Locational Marginal Pricing, Blog |
SPP LMP Map Tool Overview Energy Acuity’s LMP tool provides users with a unique ability to access, visualize and analyze Locational Marginal Pricing (LMP) across different zones. The tool provides historical real-time and day-ahead hourly LMP, Congestion and Line Loss...
by David Nurse | Apr 25, 2018 | Blog, Locational Marginal Pricing |
Download: Analyzing LMP (Locational Marginal Pricing) with Energy Acuity report available 👉 HERE What’s Included? — Tool Overview – EA’s LMP tool provides users with a unique ability to access, visualize and analyze LMP across different ISO Regions. The...

by David Nurse | Apr 19, 2018 | Blog, Locational Marginal Pricing |
Let’s say you were in the early stages of siting a wind project in Texas that will be settled at the West Texas Pricing Hub and need a better understanding of nodal-to-zone basis risk at different potential project sites. You can use EA’s mapping tools to identify...
by David Nurse | Apr 18, 2018 | Blog, Locational Marginal Pricing |
Our tool provides LMP heat mapping for all ISO regions across the U.S. This interactive mapping feature allows users to view heat maps for a single time period down to the hourly level, or to visualize LMP changes over time. Source: Energy Acuity LMP Platform The LMP...

by David Nurse | Apr 17, 2018 | Blog, Locational Marginal Pricing |
Energy Acuity’s LMP tool contains 3 Billion hourly prices from 53,370 Nodes, 112 Price Zones, and 29 Price hubs. The tool provides historical real-time and day-ahead hourly LMP, Congestion and Line Loss pricing for nodes, hubs, and zones located in PJM, CAISO, MISO,...
by David Nurse | Apr 16, 2018 | Blog, Locational Marginal Pricing |
#1 System Energy Price LMPs are made up of System Energy Price, Congestion Costs, and Losses. System Energy Price represents the cost to serve power on a system, ignoring transmission and congestion costs. In organized markets, power plants are dispatched lowest cost...
by David Nurse | Apr 13, 2018 | Blog, Locational Marginal Pricing |
The third component of LMPs is the cost of marginal losses. Losses are just electricity that is lost during long-distance transport. So, the closer your power plant is to the load that it is serving, the lower your Losses are, and the further away it is, the higher...
by David Nurse | Apr 12, 2018 | Blog, Locational Marginal Pricing |
Congestion costs represent the price of congestion at binding constraints on the power system. Congestion costs arise when, in order to respect constraints in the transmission system, higher cost generation must be used to meet load as opposed to lower cost generation...
by David Nurse | Apr 12, 2018 | Blog, Locational Marginal Pricing |
LMPs are made up of System Energy Price, Congestion Costs, and Losses. System Energy Price represents the cost to serve power on a system, ignoring transmission and congestion costs. In organized markets, power plants are dispatched lowest cost to highest cost;...

by David Nurse | Apr 11, 2018 | Blog, Locational Marginal Pricing |
What is Locational Marginal Pricing (LMP)? LMP stands for Locational Marginal Pricing and represents the cost to buy and sell power at different locations within wholesale electricity markets, usually called Independent System Operators (ISOs). Examples of ISOs...


