Locational Marginal Pricing (LMP)
LMP Node Search, Map, Compare ✔️
Search
Search through LMP data by ISO, state, hub, zone, or node. Easily find nodes based on pricing characteristics (average, min, max) congestion, and line loss.
Mapping
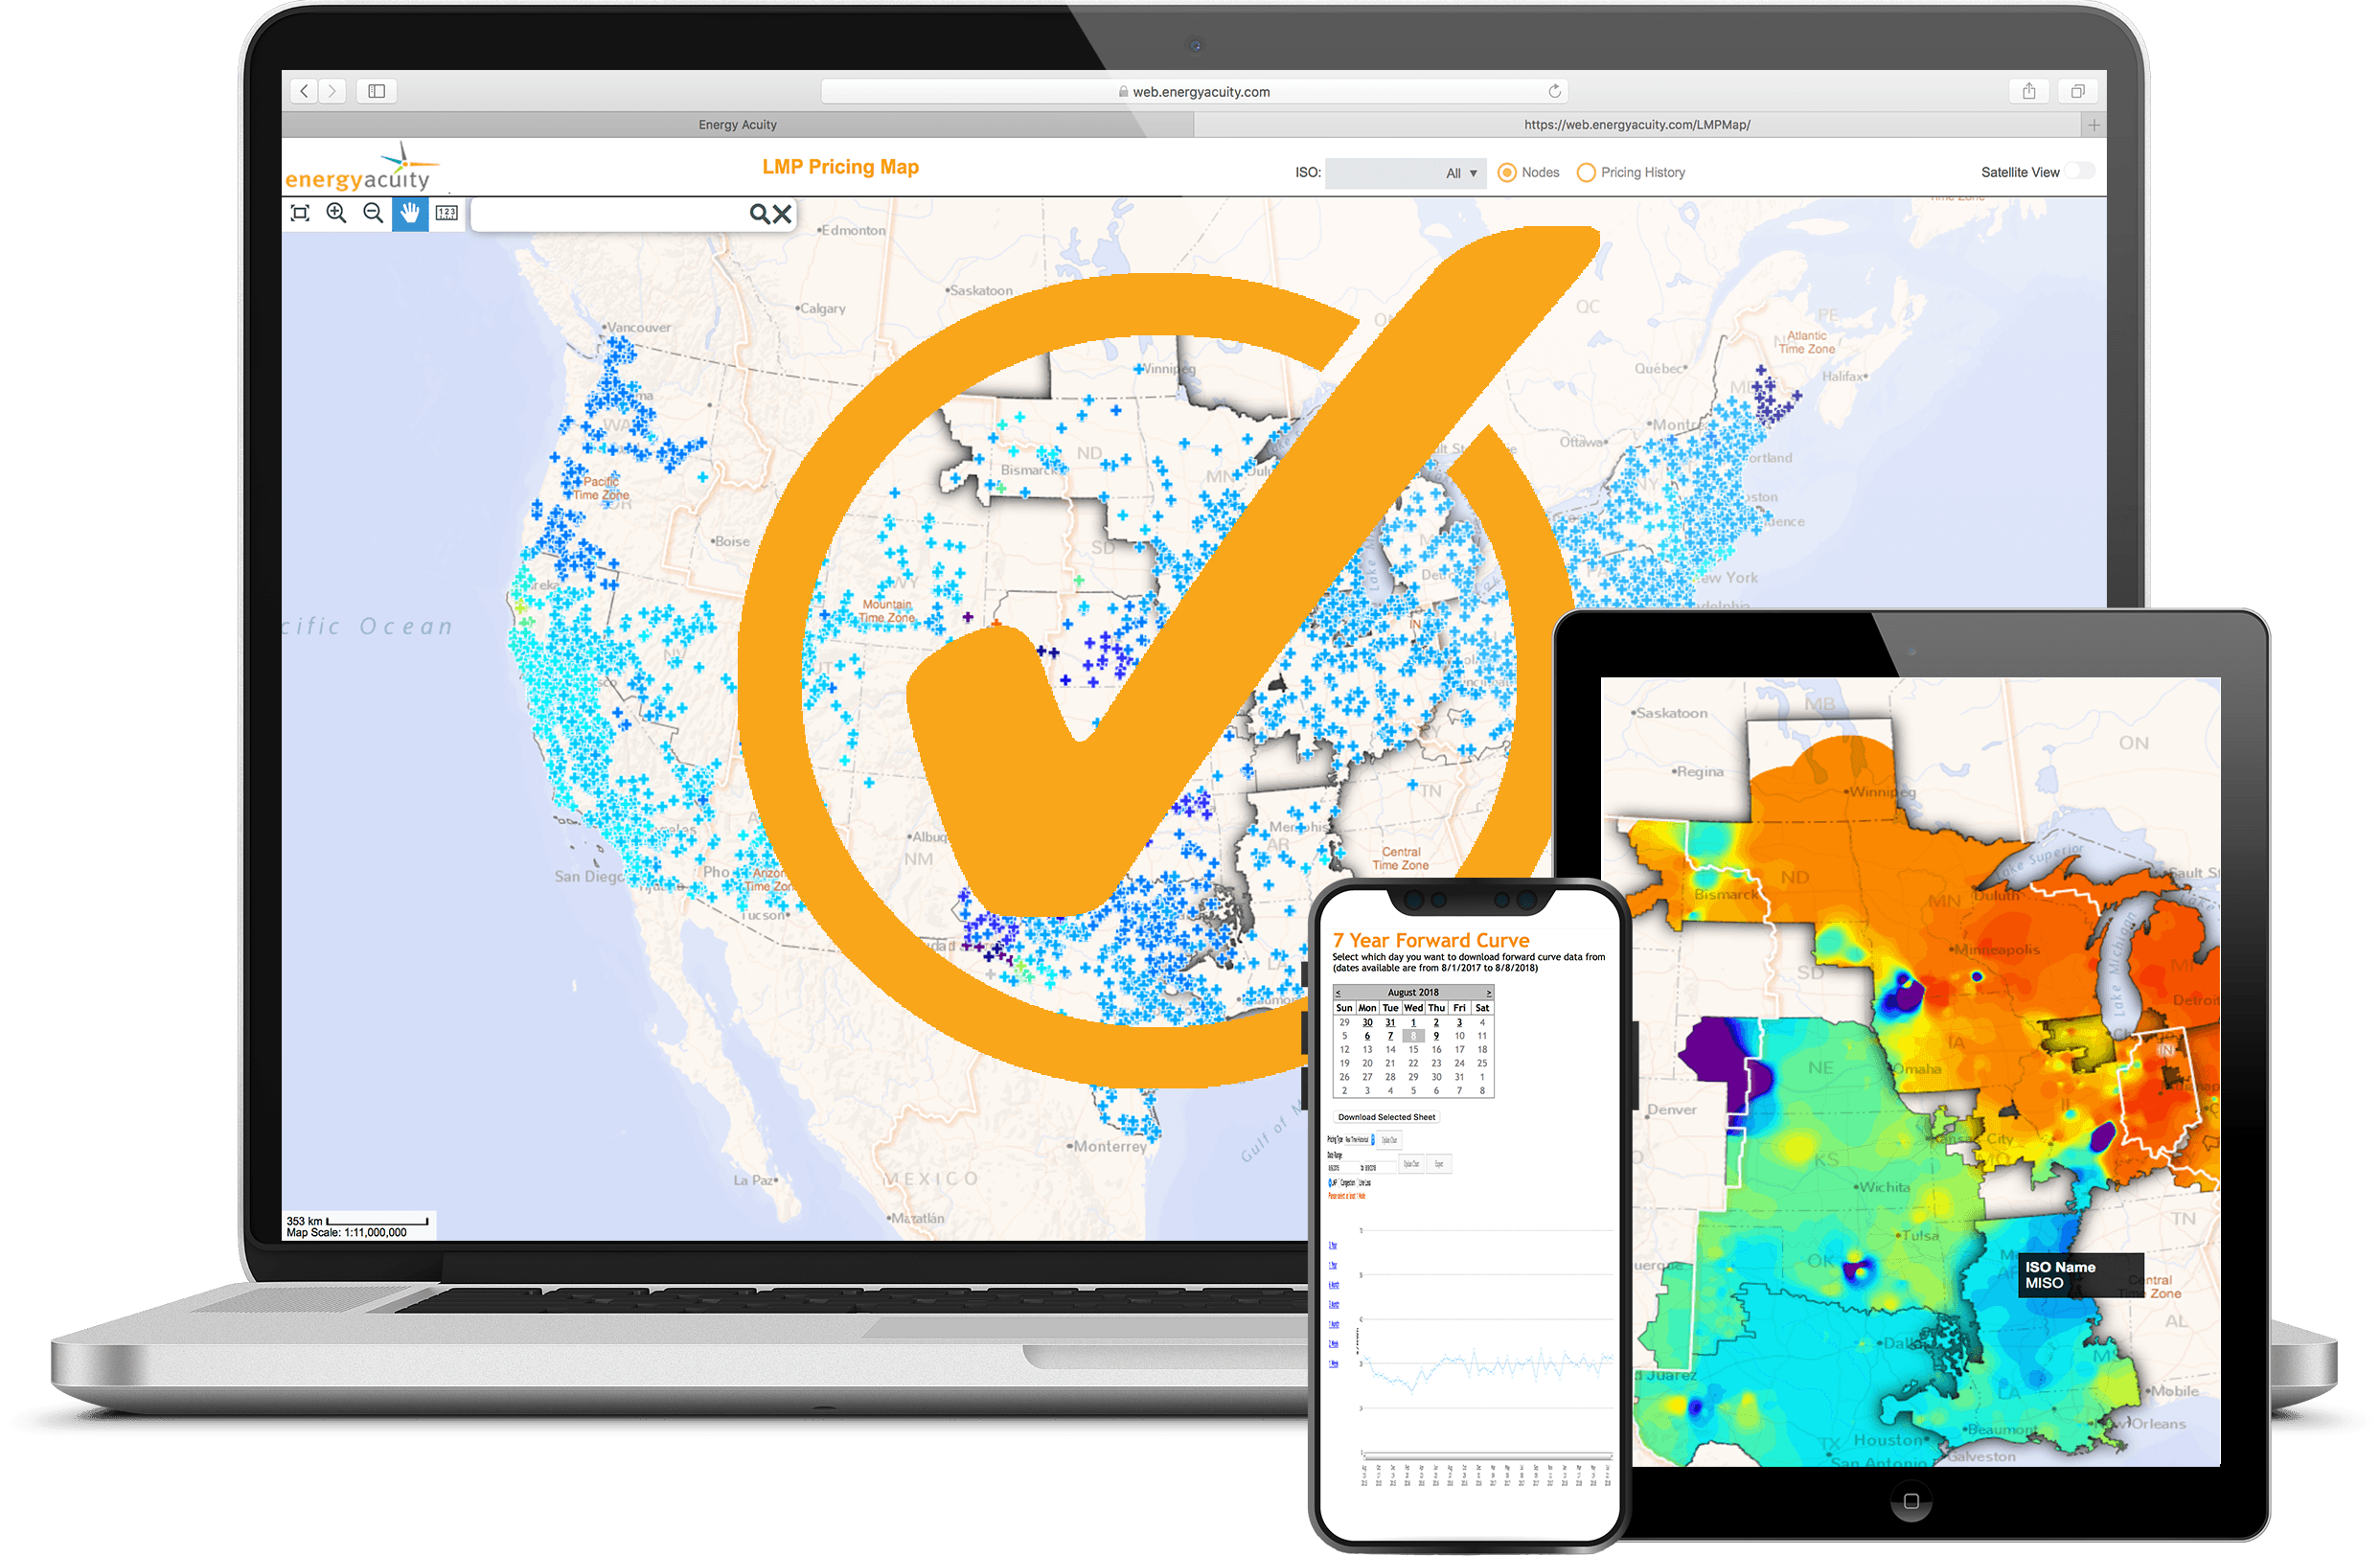
View the physical location of LMP nodes in our mapping feature. Find nodes around potential projects sites to create proxy nodes for siting analysis, and layer on nearby transmission, power, and property data to get a better sense of how the project would interconnect, potential offtakers, and other plants operating or being built nearby. Integrates seamlessly with our node comparison tool to allow you to select various nodes on a map and compare their historical performance instantly.
Compare
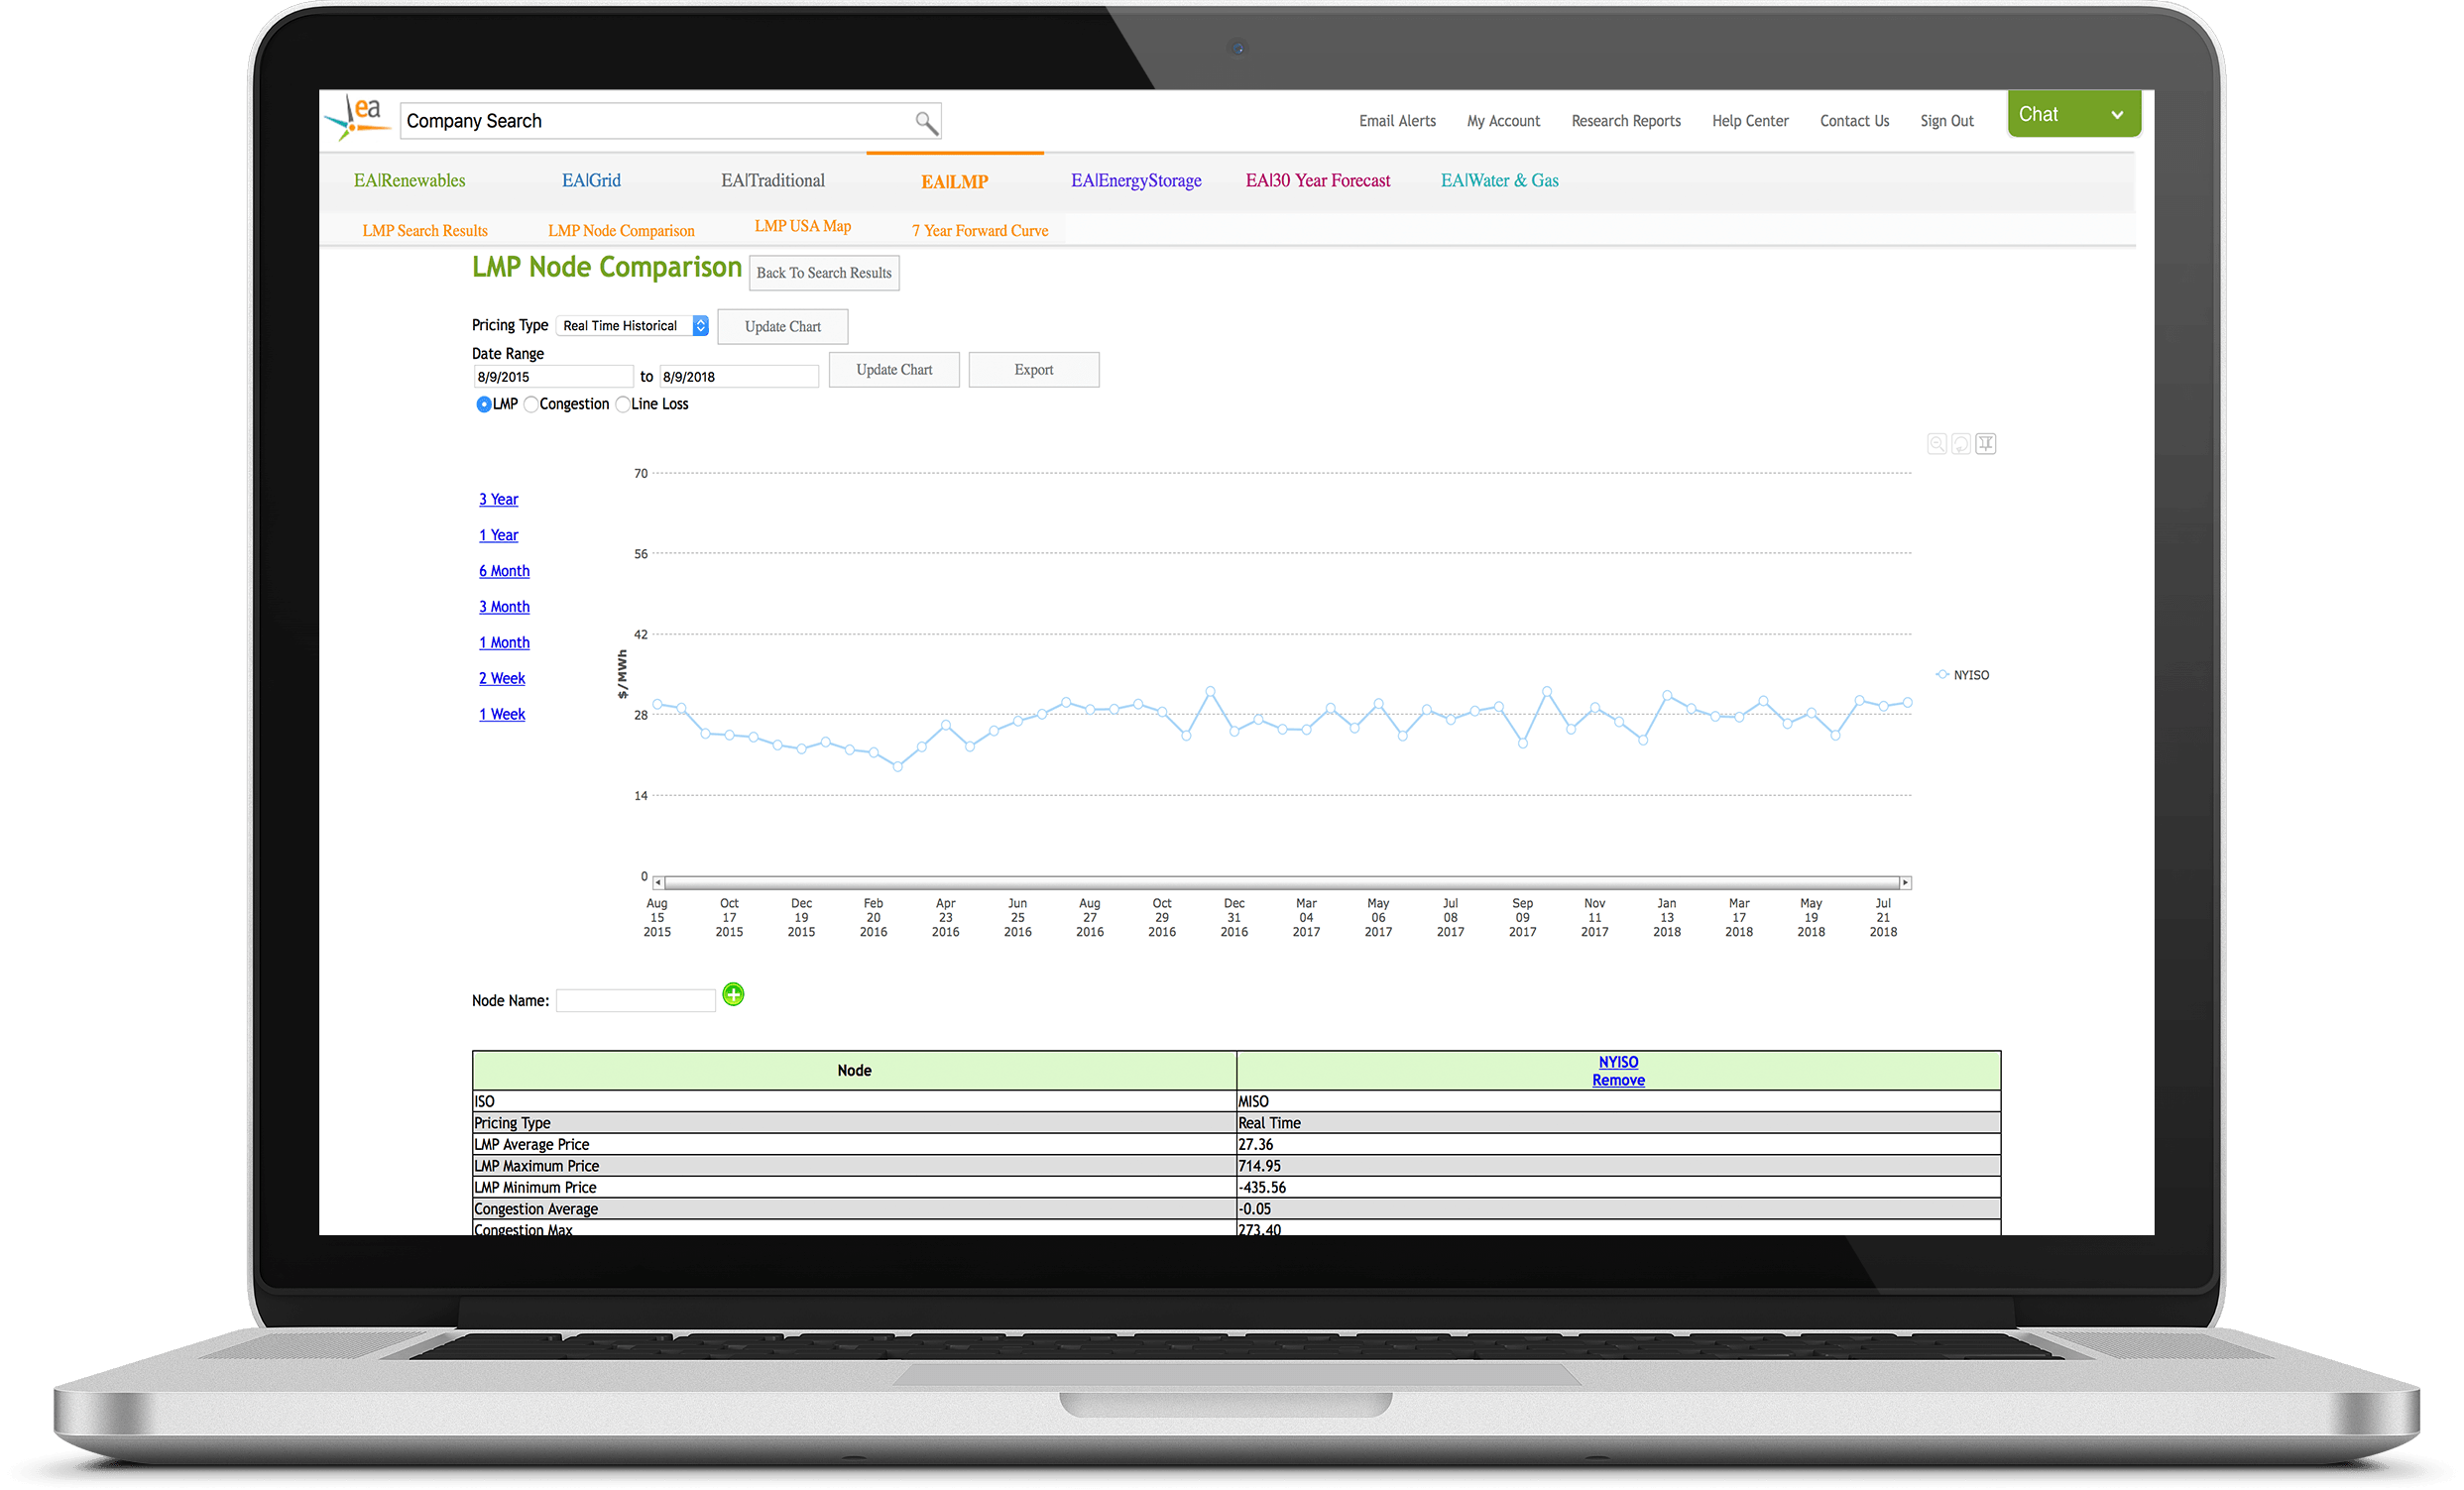
Easily compare historical hourly energy prices at all nodes and hubs across the U.S. to analyze basis risk and assist in project siting. Easily export data to excel for more granular analysis.

LMP Heat Map
Need to view prices on a macro level or visualize price changes? Our heatmapping tool allows users to visualize LMP price changes over time and take a different view on regional pricing analysis.
See Energy Acuity In Action
Tell us a little about yourself, and we’ll show you why hundreds of companies trust Energy Acuity to provide Accurate & Granular Renewable Energy Intelligence.
What To Expect:
Is EA Right For Me?
After submitting a demo request, your dedicated Account Executive will contact you to learn more about your business and if Energy Acuity will be a good fit. We’ll know within the first 10-15 minutes if Energy Acuity is a viable solution for your business needs or use cases.
Round Up The Team & Watch EA Work!
If EA fits your needs, your Account Executive will schedule a 30 minute customized demo specifically tailored to your business!
