LMP Map
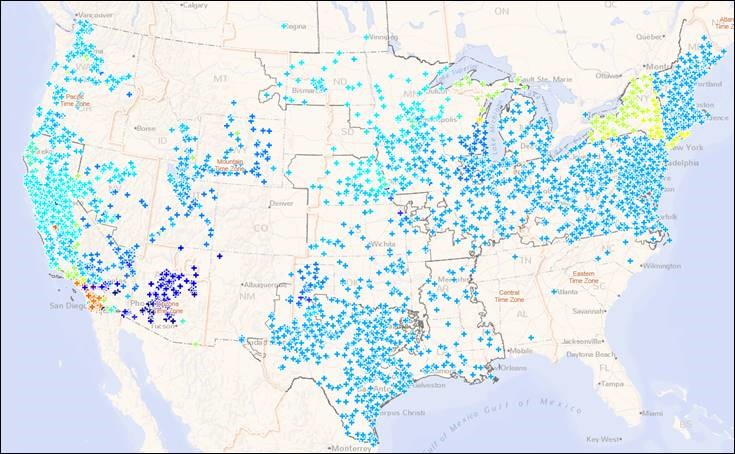
The Energy Acuity LMP product provides LMP mapping for all ISO regions across the United States. This interactive mapping feature allows users to view heat maps for a single time period down to the hourly level, or to visualize LMP changes over time.

The LMP tool also has a feature that maps all LMP nodes and hubs down to the street-view level. Users can hover over the hubs for node names and pricing information.


LMP Product Overview
The LMP product contains 3 Billion hourly prices from 53,370 Nodes, 112 Price Zones, and 29 Price hubs. The tool also provides historical real-time and day-ahead hourly LMP, Congestion and Line Loss pricing for nodes, hubs, and zones located in PJM, CAISO, MISO, SPP, ISO-NE and NYISO. Our easy to use interface allows users to compare prices at different nodes over time and easily export the data to excel for more in-depth analysis.
2018 LMP Report
Download: Analyzing LMP (Locational Marginal Pricing) with Energy Acuity report available here: https://goo.gl/h7gsyk
What’s Included?
— Tool Overview – EA’s LMP tool provides users with a unique ability to access, visualize and analyze LMP across different ISO Regions. The tool provides historical real-time and day-ahead hourly LMP, Congestion and Line Loss pricing for nodes, hubs, and zones located in PJM, CAISO, MISO, SPP, ISO-NE, and NYISO.
— LMP Historical Analysis – EA’s LMP tool allows users to easily compare historical prices at different nodes over time. For example, the above chart shows variations between real-time LMPs at the different ERCOT Hubs. This data can be easily exported to excel for more in-depth analysis.
— LMP Price and Node Mapping – Our tool provides LMP heat mapping for all ISO regions across the U.S. This interactive mapping feature allows users to view heat maps for a single time period down to the hourly level, or to visualize LMP changes over time.
— Basis Risk Analysis – You can use EA’s mapping tools to identify proxy wind nodes near different sites you are considering. These proxy nodes will have similar characteristics such as wind speed, frequency, and transmission constraints at the nearby sites you are considering.
Download the Full Report: https://goo.gl/h7gsyk
Source: Energy Acuity
Request a Free Demo of the Energy Acuity PlatformToday!
Energy Acuity (EA) is the leading provider of power generation and power delivery market intelligence. Founded in 2008, EA was built on the principle that essential energy market research could be conducted and presented more efficiently than the traditional third-party data providers.
EA’s unique approach merges primary research, public resource aggregation, web monitoring and expert analysis that is delivered through a simple, dynamic online platform. This allows our clients to focus on actionable information and win business over the competition.


